Takings and revenue
See what the clinic has taken over any period, day by day, with the VAT worked out, and compare it with the period before.
Where
Reports, Business, then Revenue / KPI.
Who
The clinic manager.
After
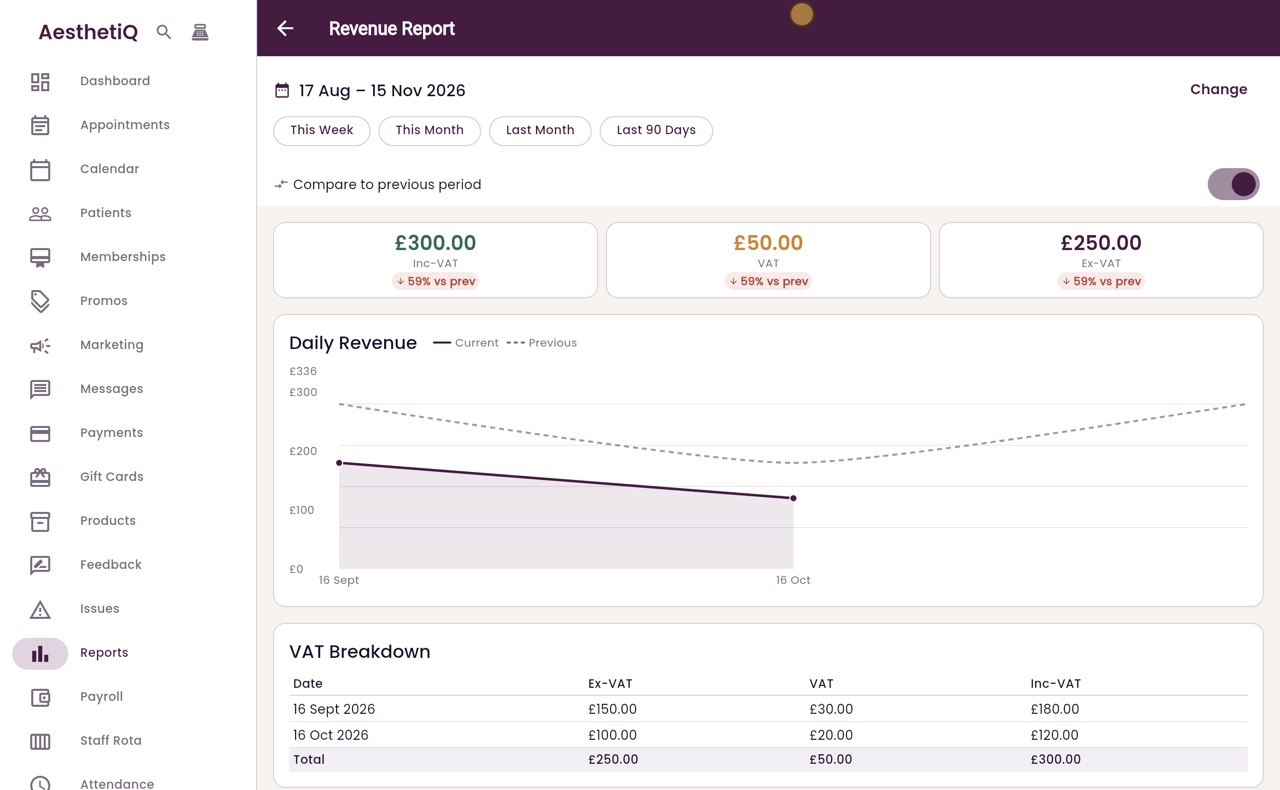
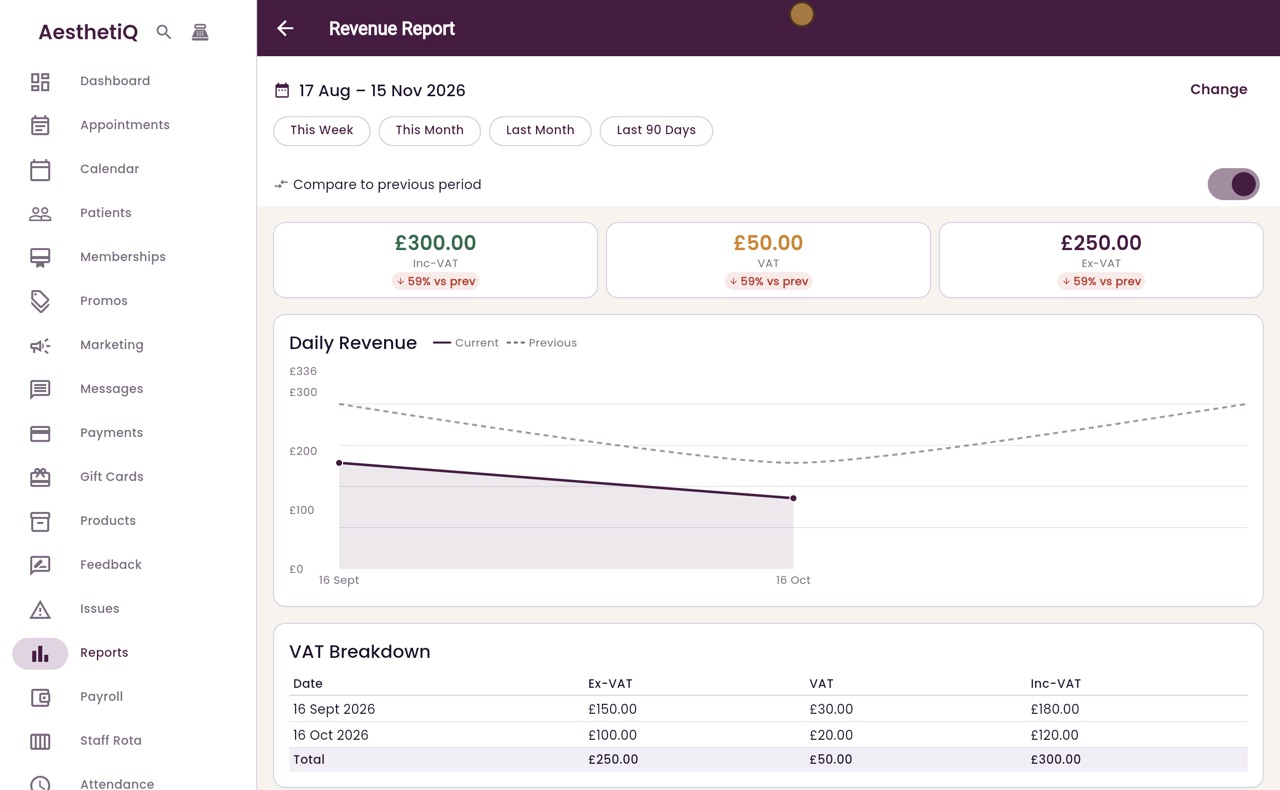
Compare to previous period shows the change against the period before.
Step by step
- 01Libby
The Revenue report
Hi, I am Libby. The Revenue report shows what the clinic has taken over a period, day by day, with the VAT worked out for you.
- 02Ryan
Open the report
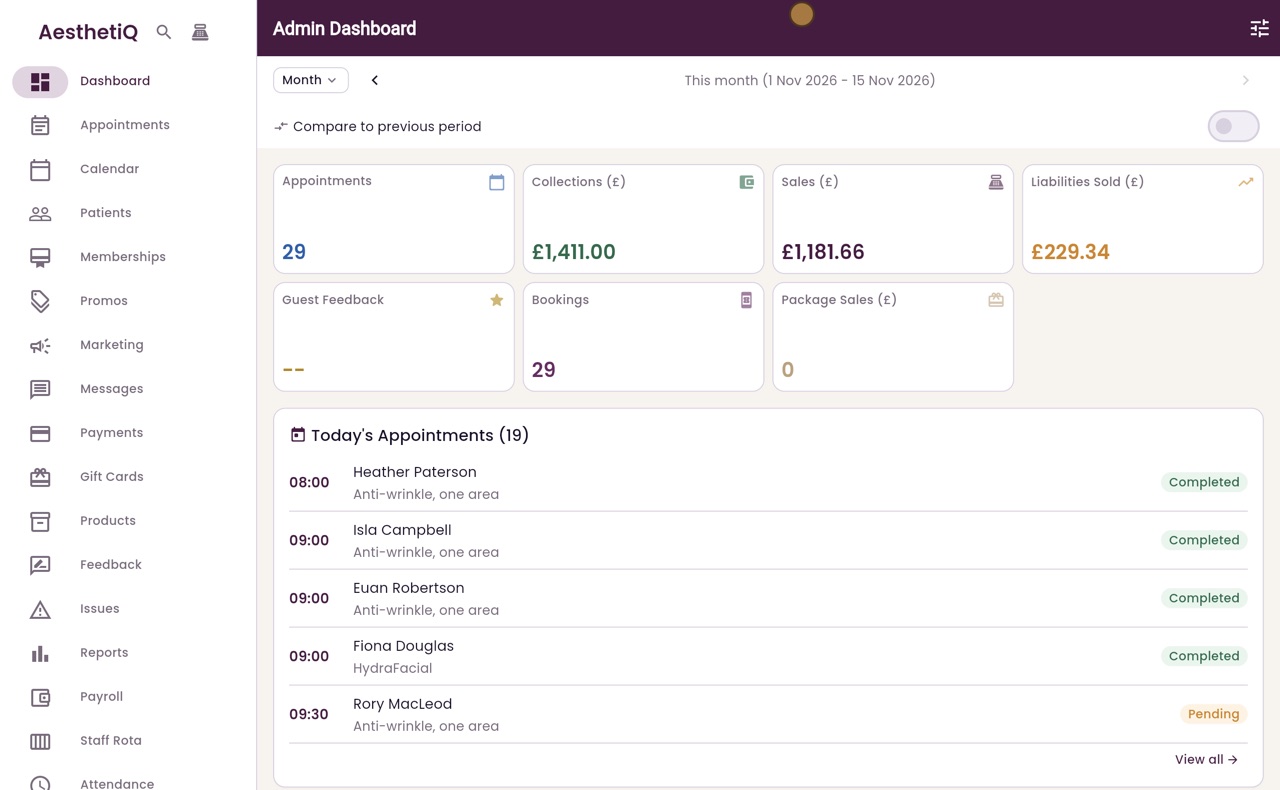
Thanks Libby. Click Reports in the menu on the left, open Business, then click Revenue / KPI.
- 03Ryan
Choose the period
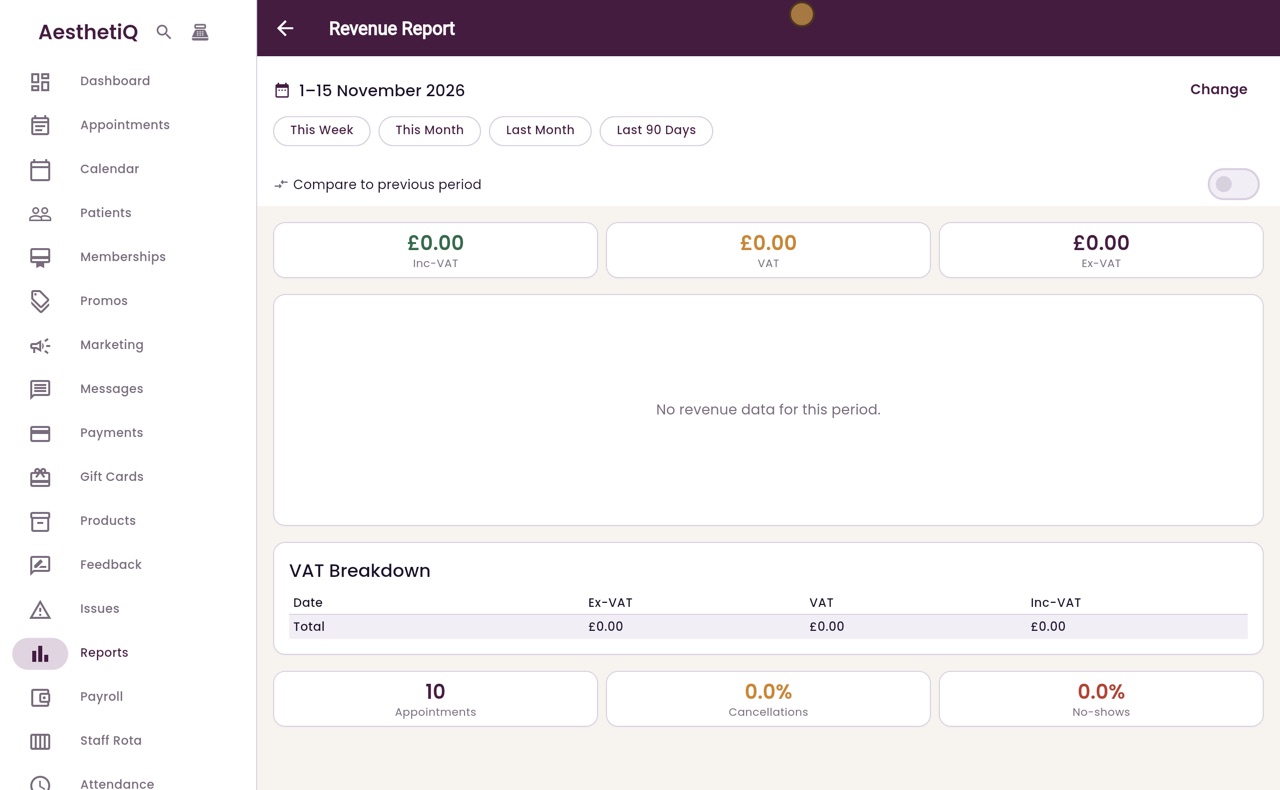
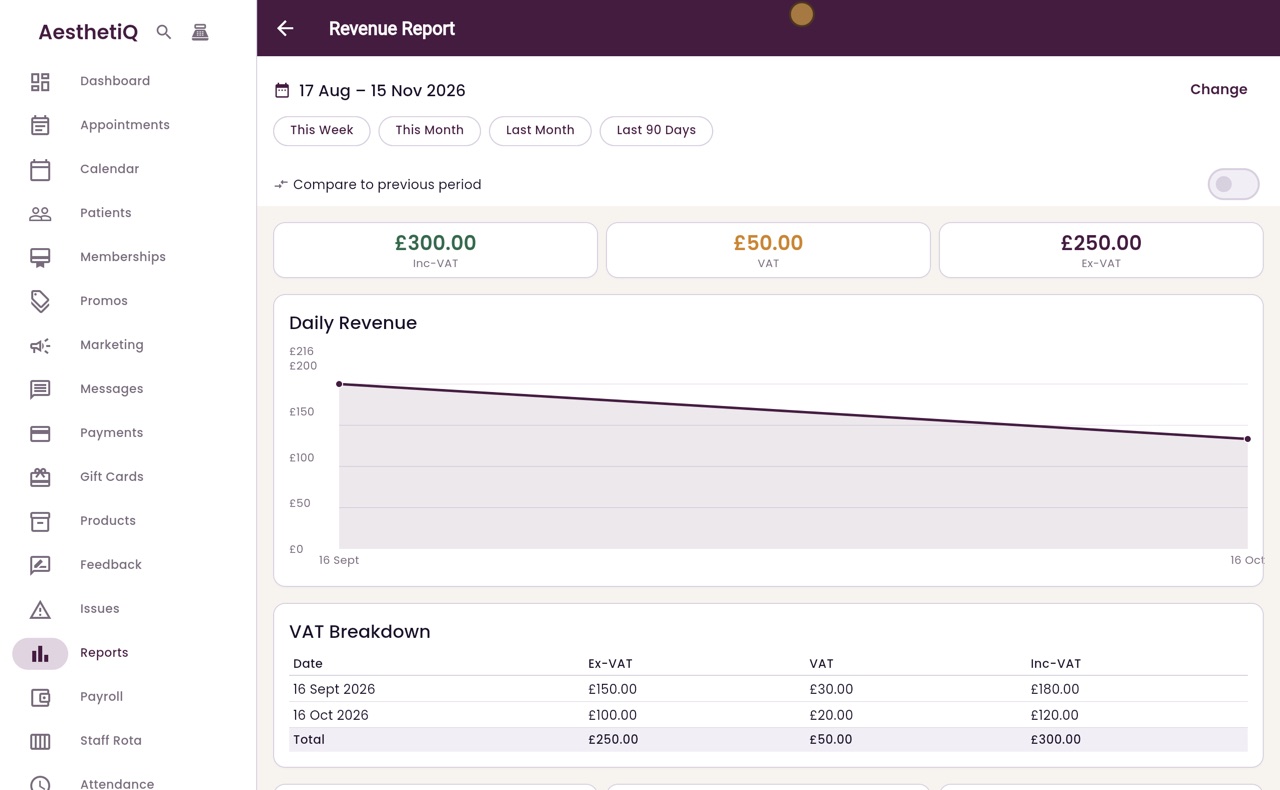
Choose the period with the buttons at the top. Click Last 90 Days.
- 04Ryan
The totals
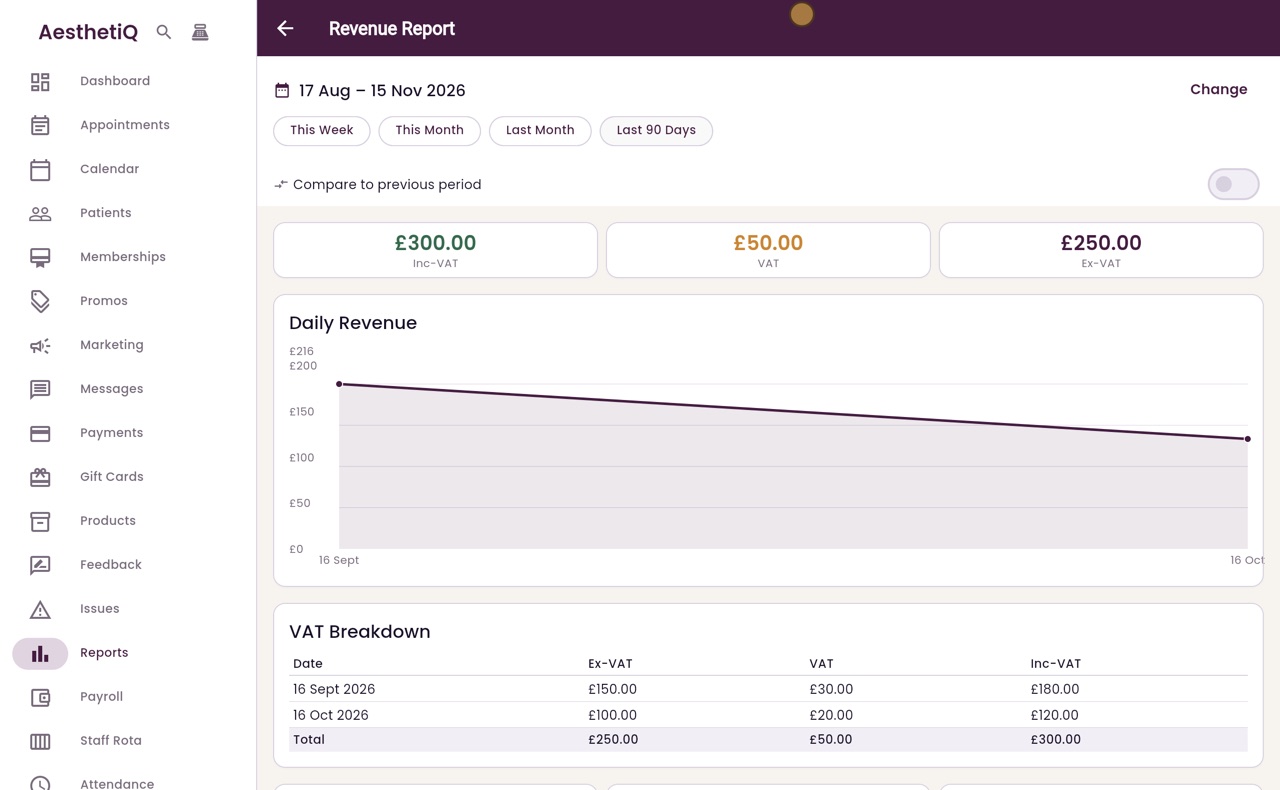
At the top are the takings including VAT, the VAT, and the takings without VAT. The chart shows the takings on each day.
- 05Ryan
VAT and appointments
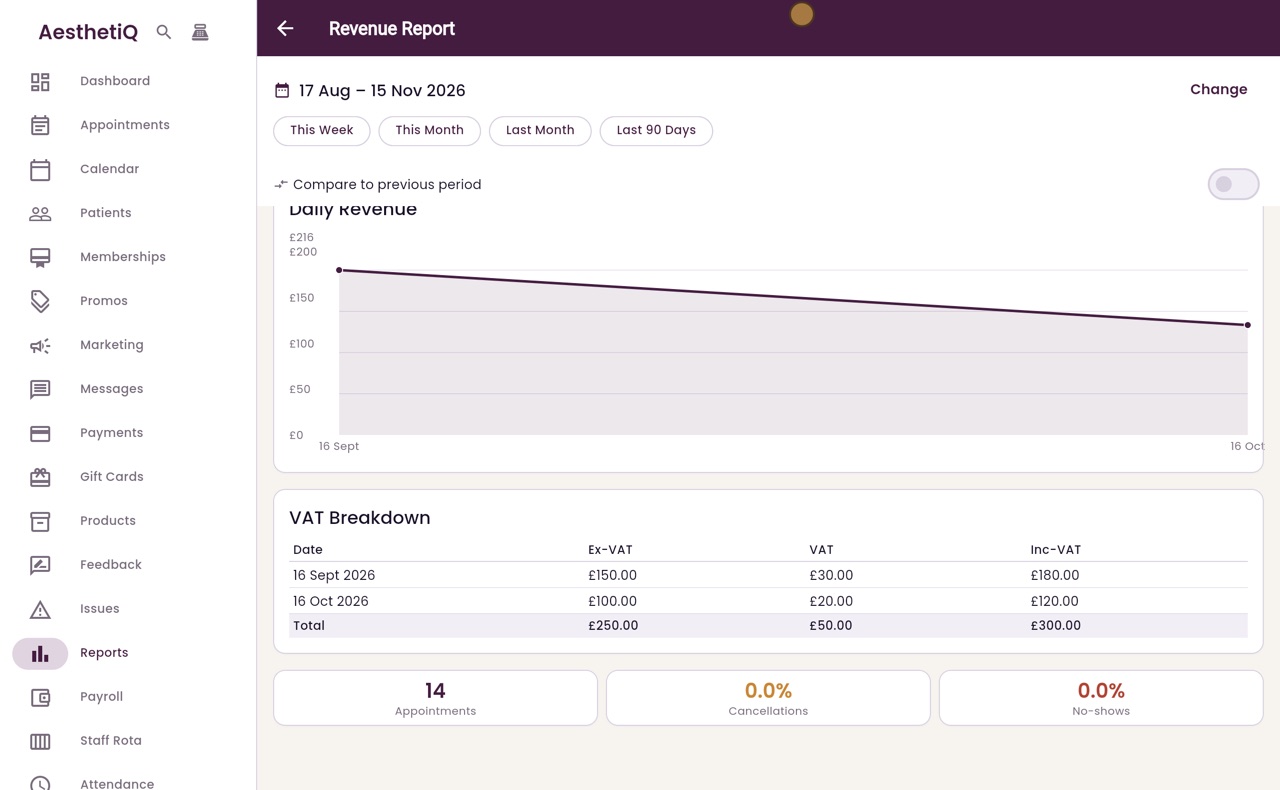
Below, the VAT breakdown lists each day with takings, and the total. Underneath are the number of appointments, and the share that were cancelled or missed.
- 06Ryan
Compare
Switch on Compare to previous period. Each figure now shows the change against the ninety days before, and the chart adds the earlier period as a dotted line.
- 07Libby
Done
That is the Revenue report. Click Change at the top to pick your own dates, for example a VAT quarter.